

Monday charts

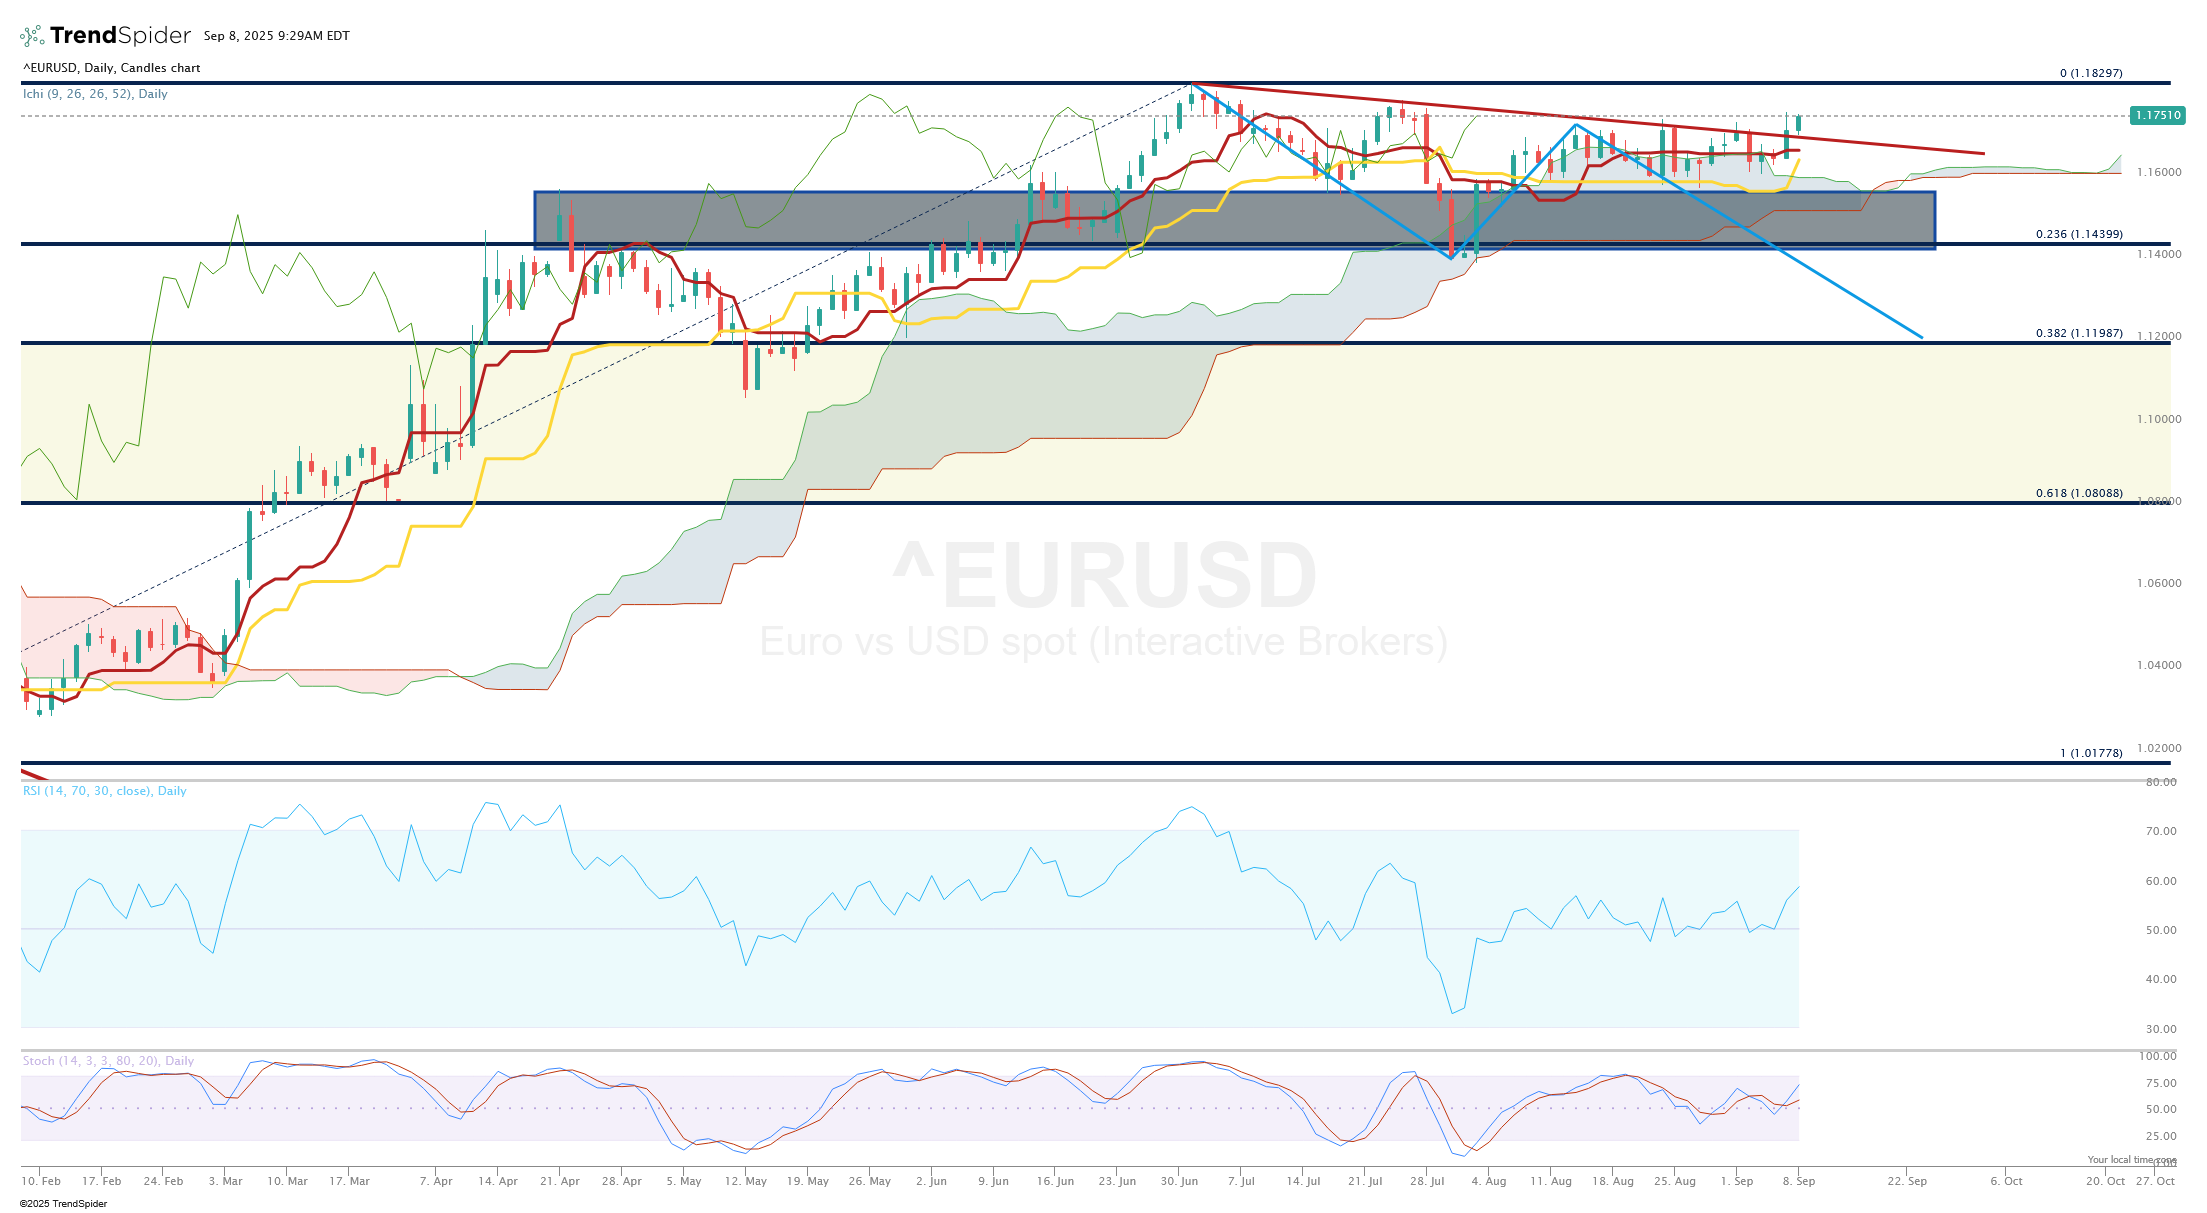
Last Friday the daily candlestick closed above the resistance trend line and I closed my short position in EURUSD with a loss. Cloud support remains respected. Breaking above the red trend line is an important short-term bullish signal.
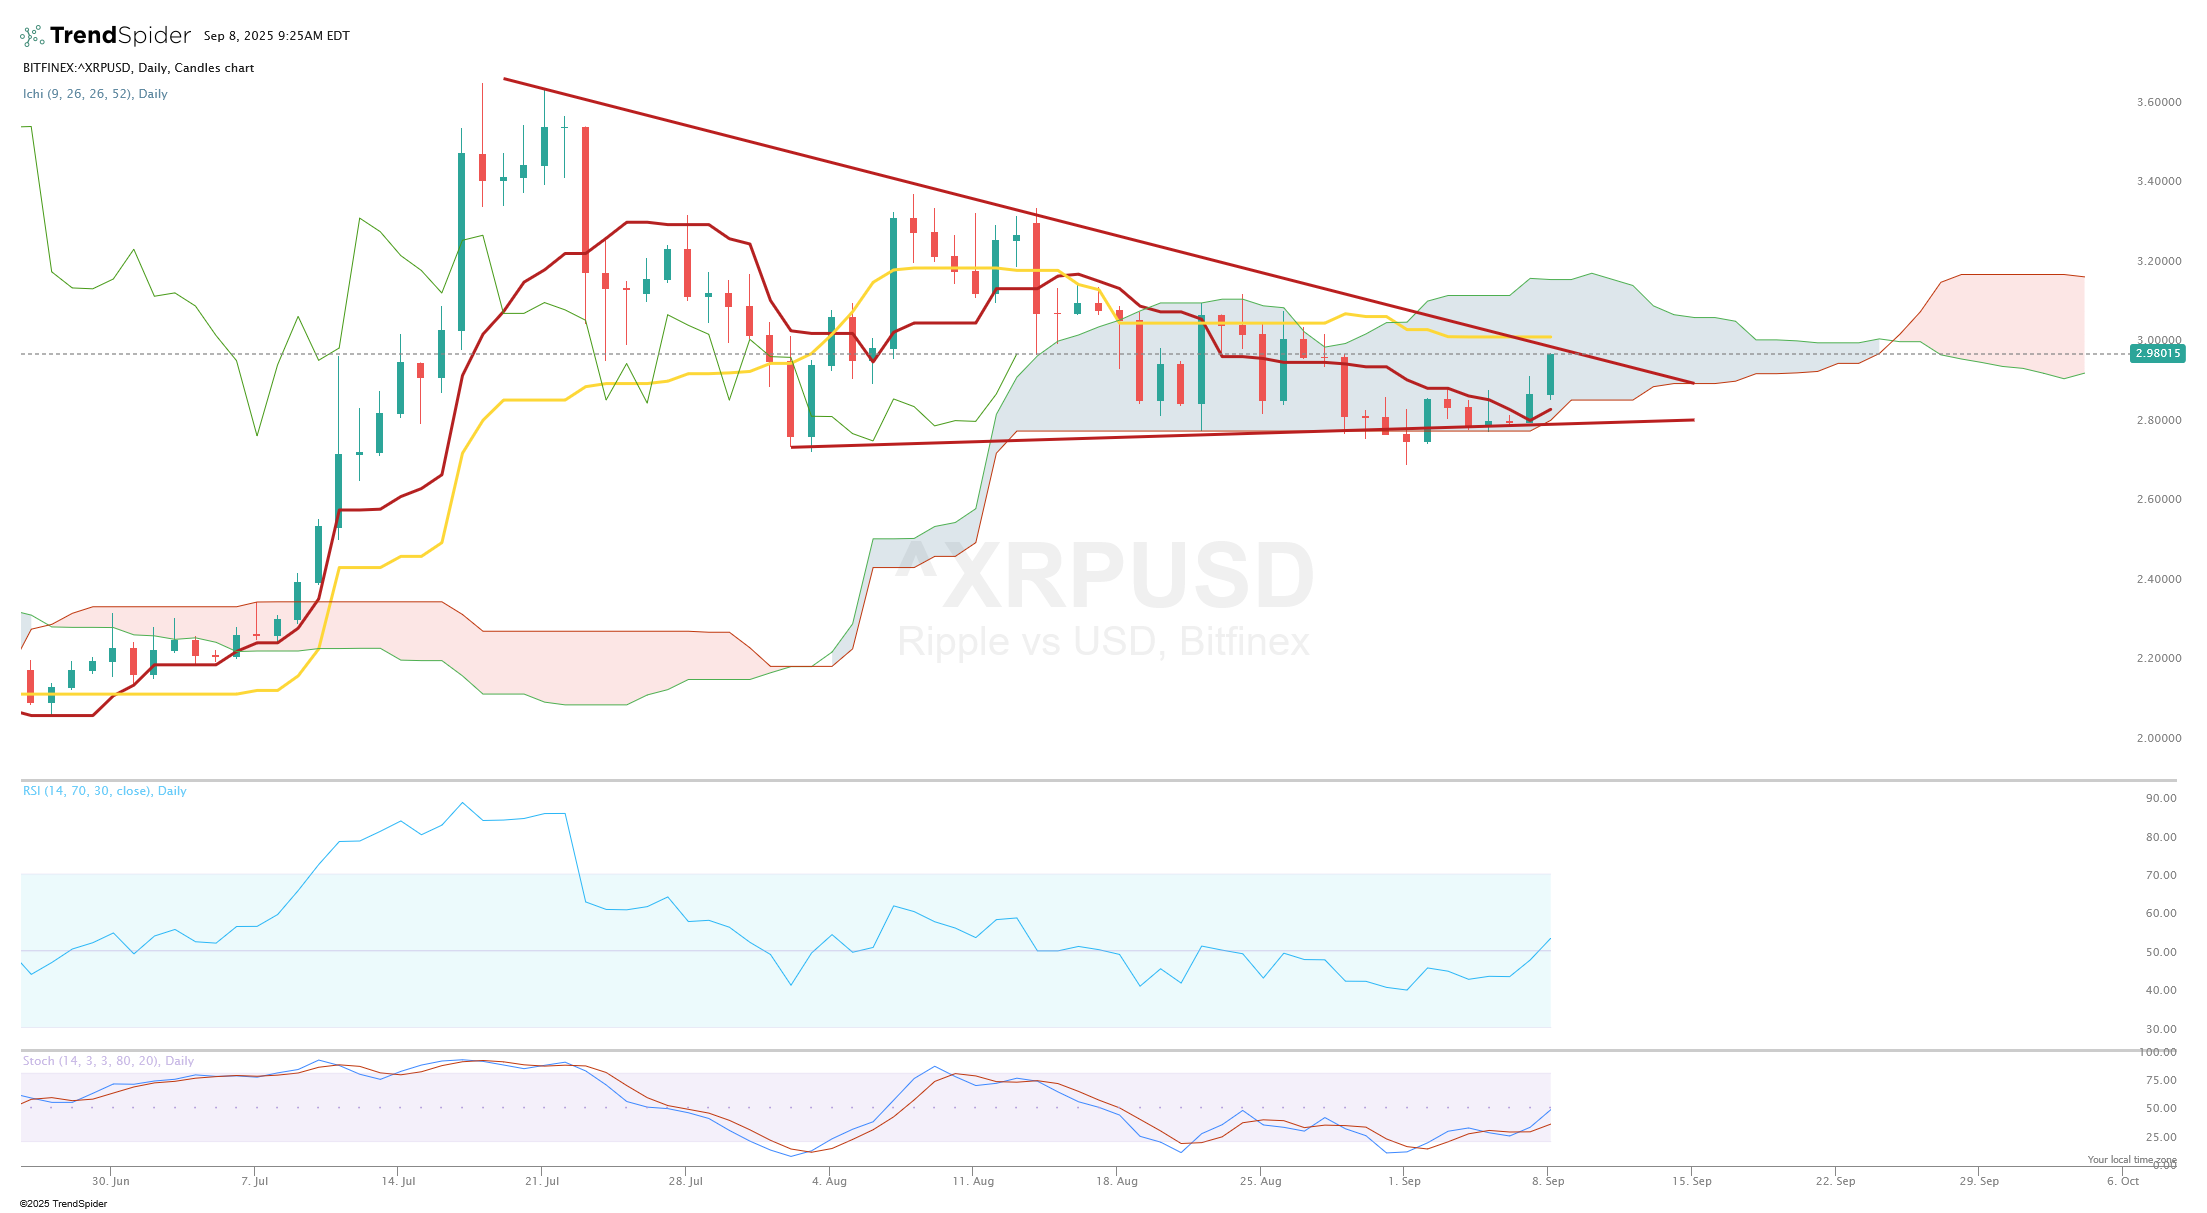
XRP is challenging important resistance. Inside the cloud trend is neutral. Breaking above the triangle would be a bullish sign.
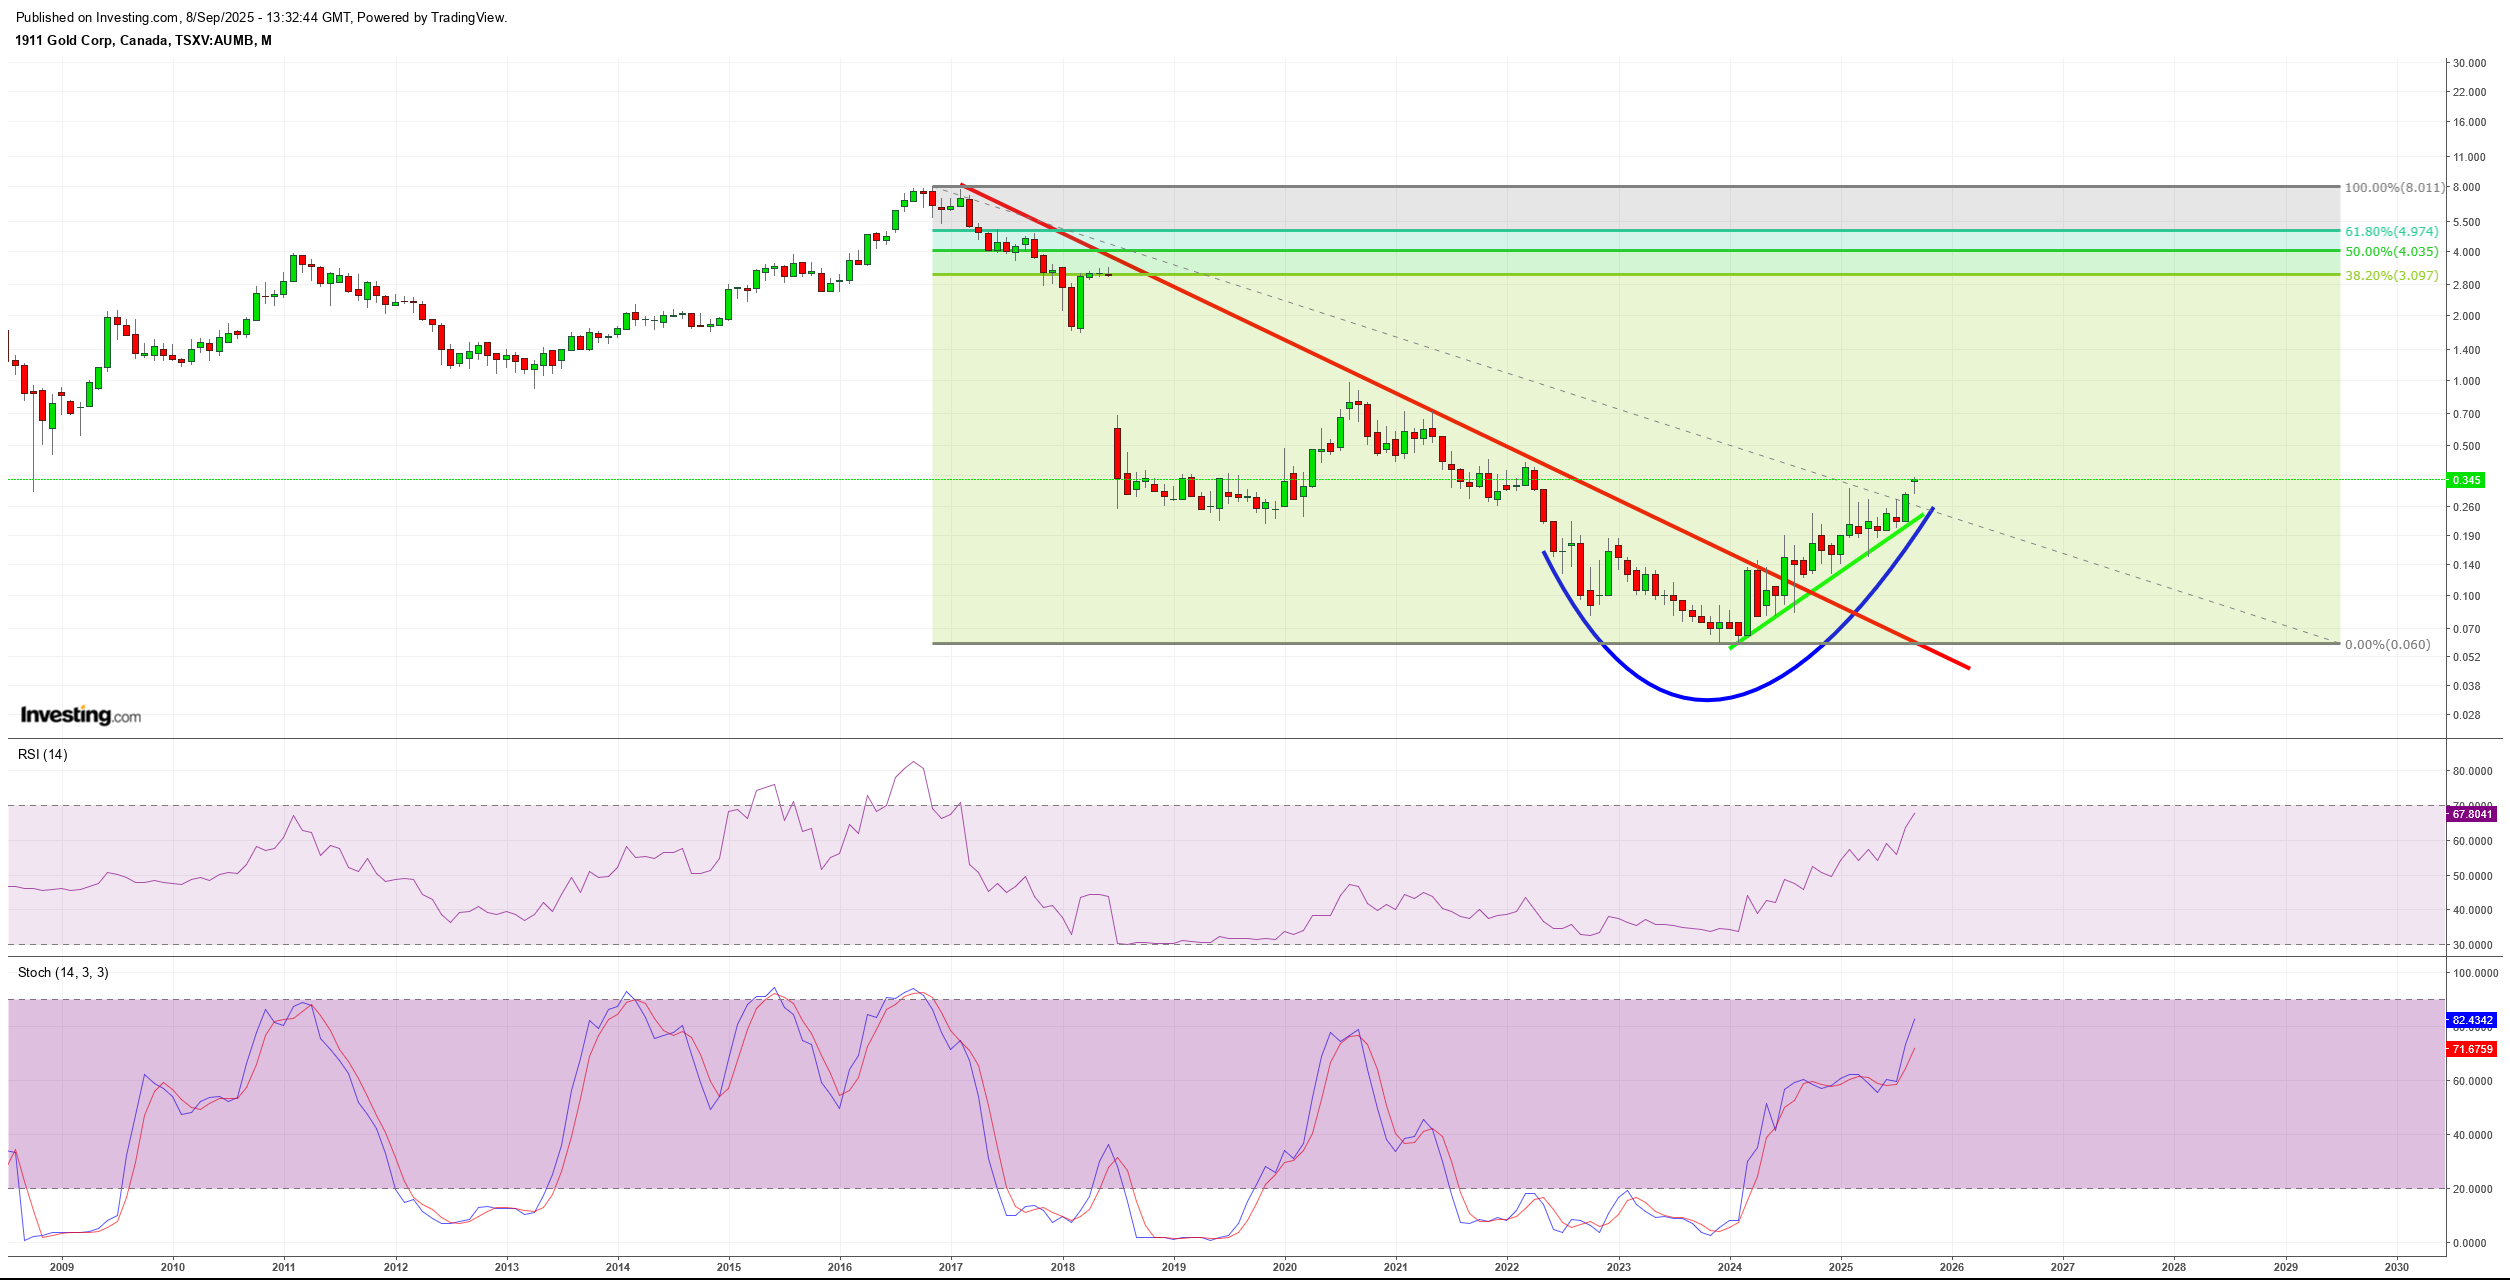
$AUMB Crazy scenario to retrace the decline? so far looks like it is bottoming and turning upwards.
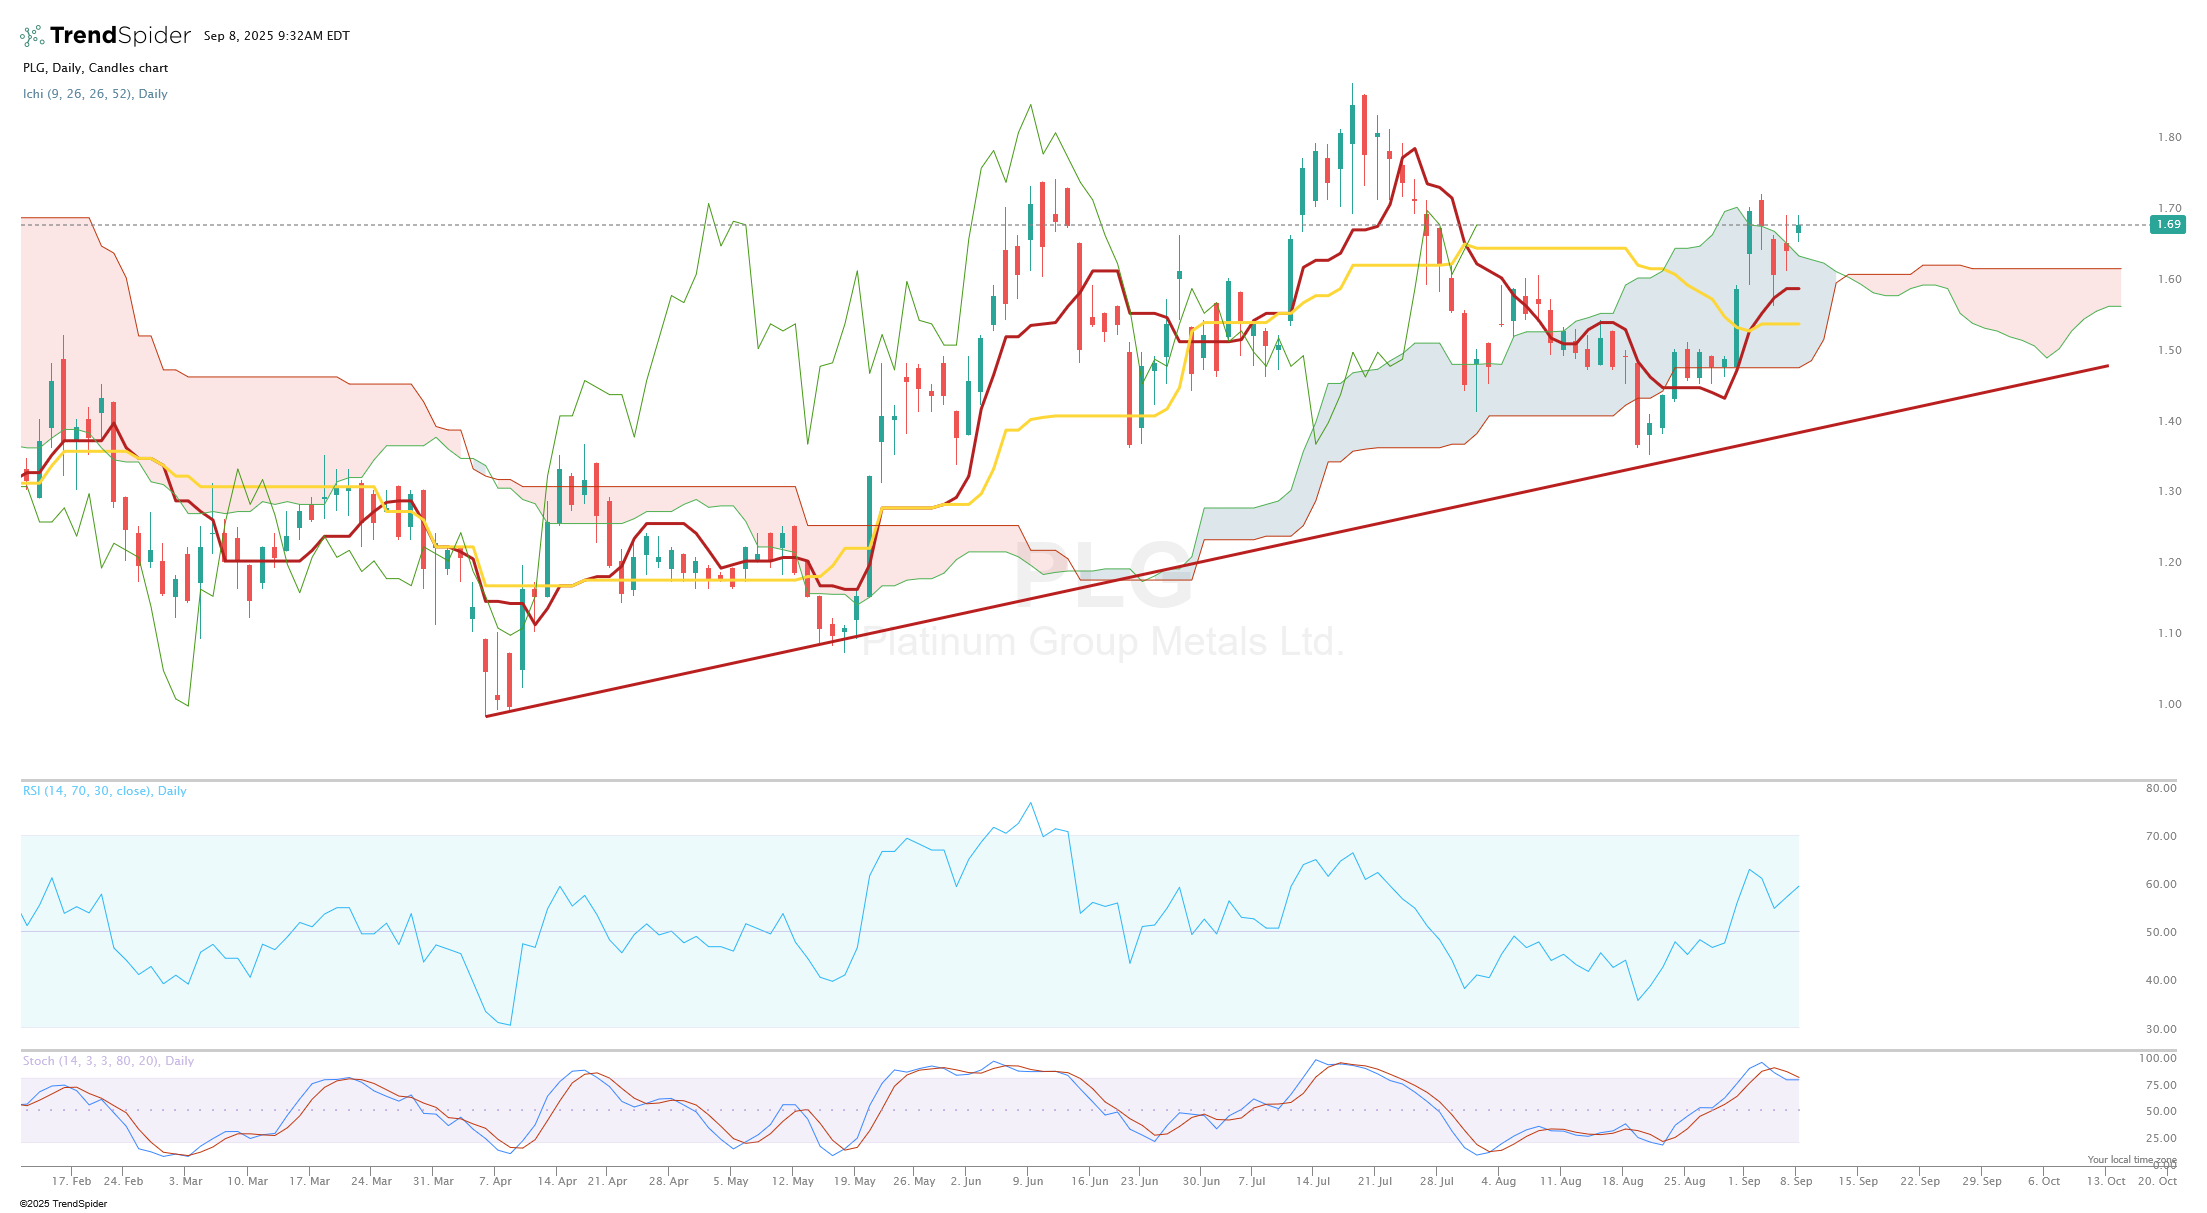
PLG 0.00%↑ respecting support and breaking above the cloud.
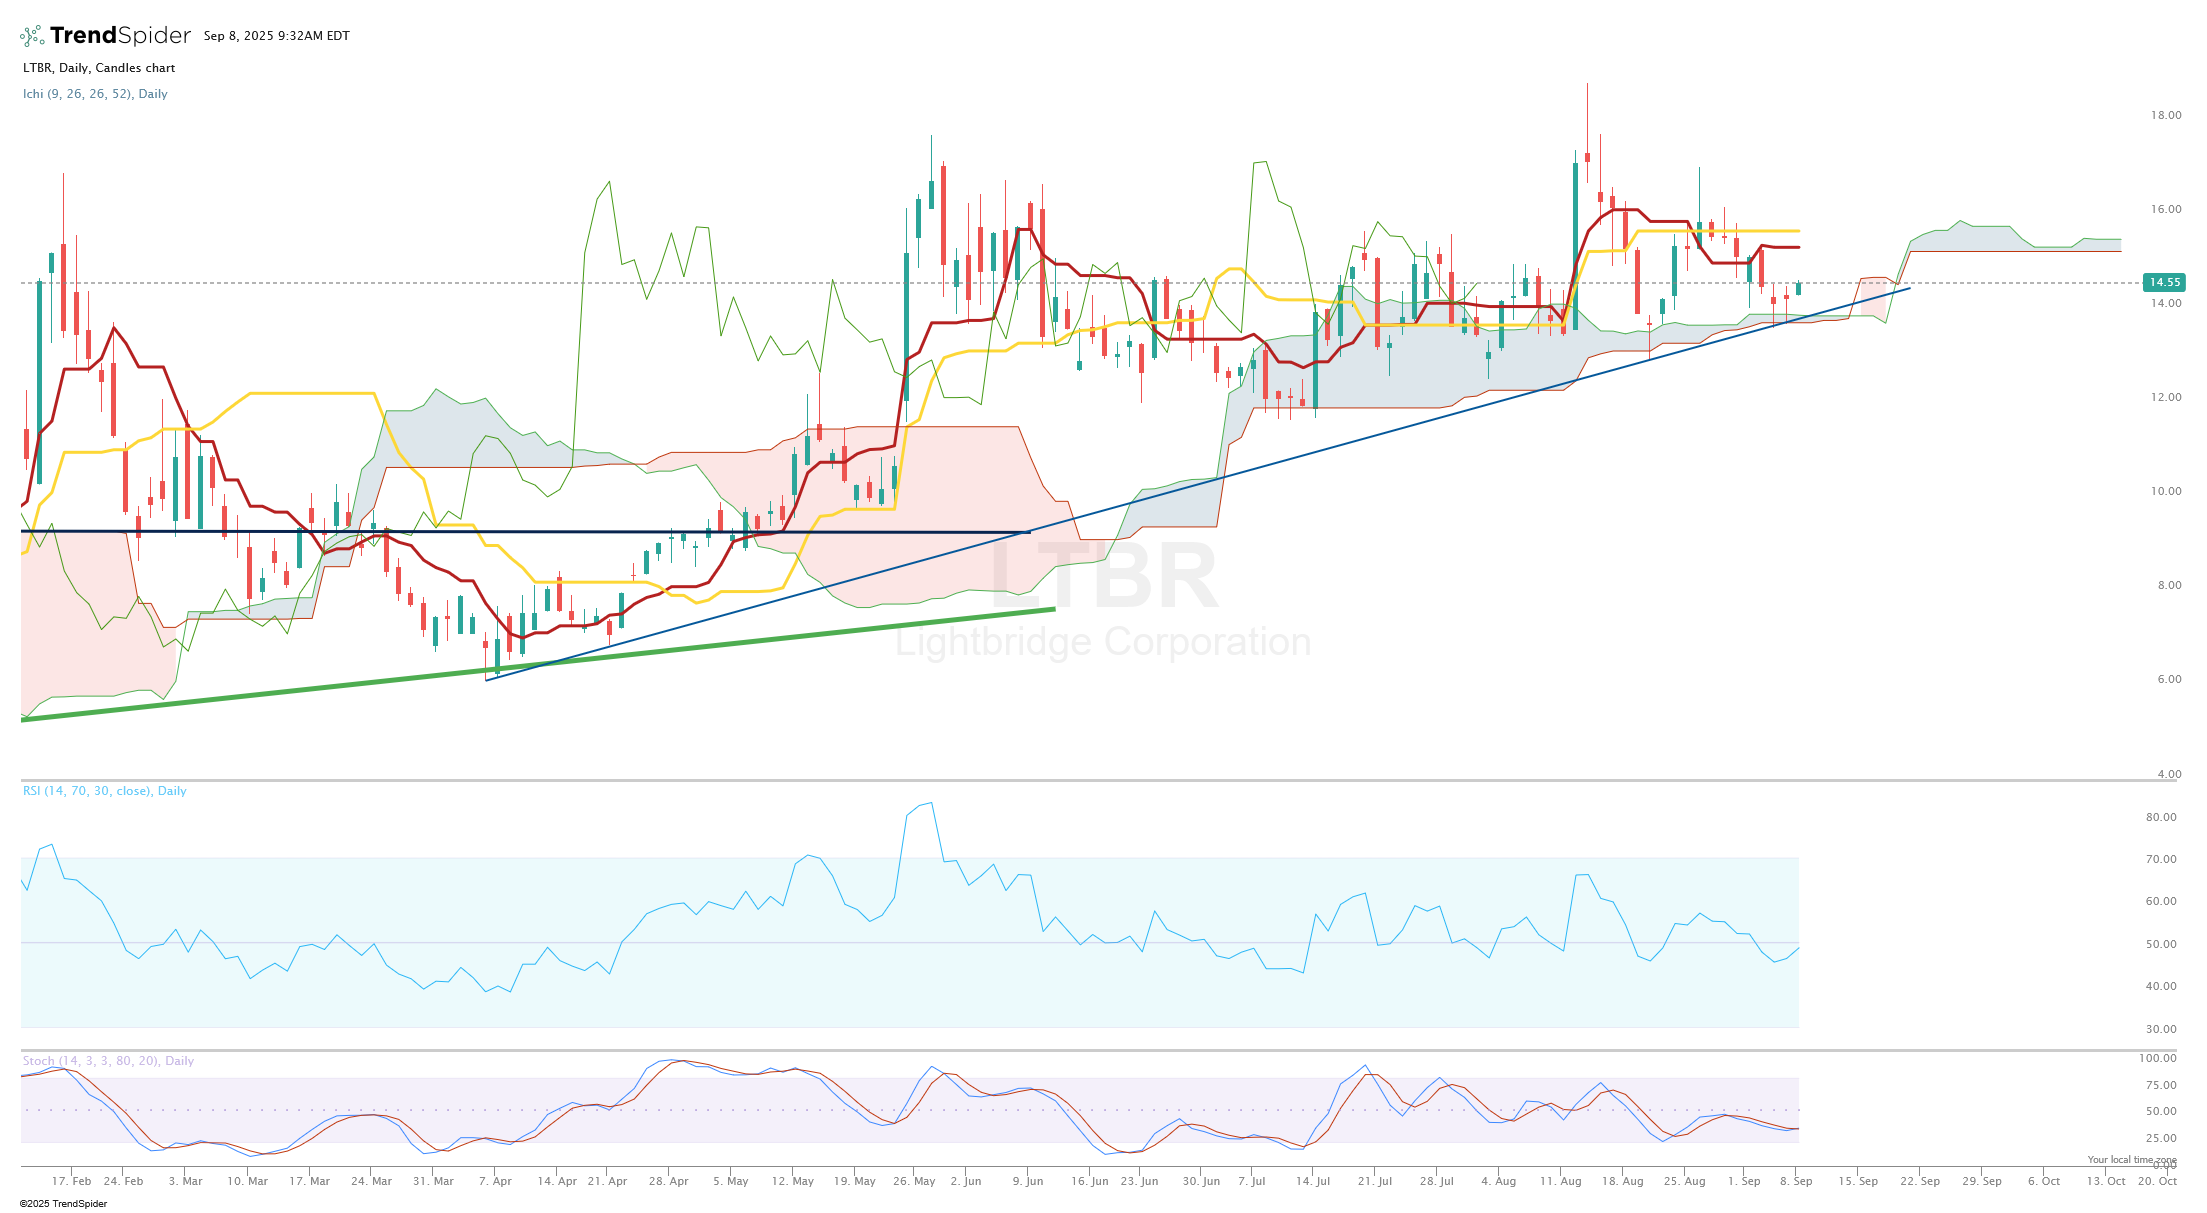
LTBR 0.00%↑ respecting support trend line and cloud support.
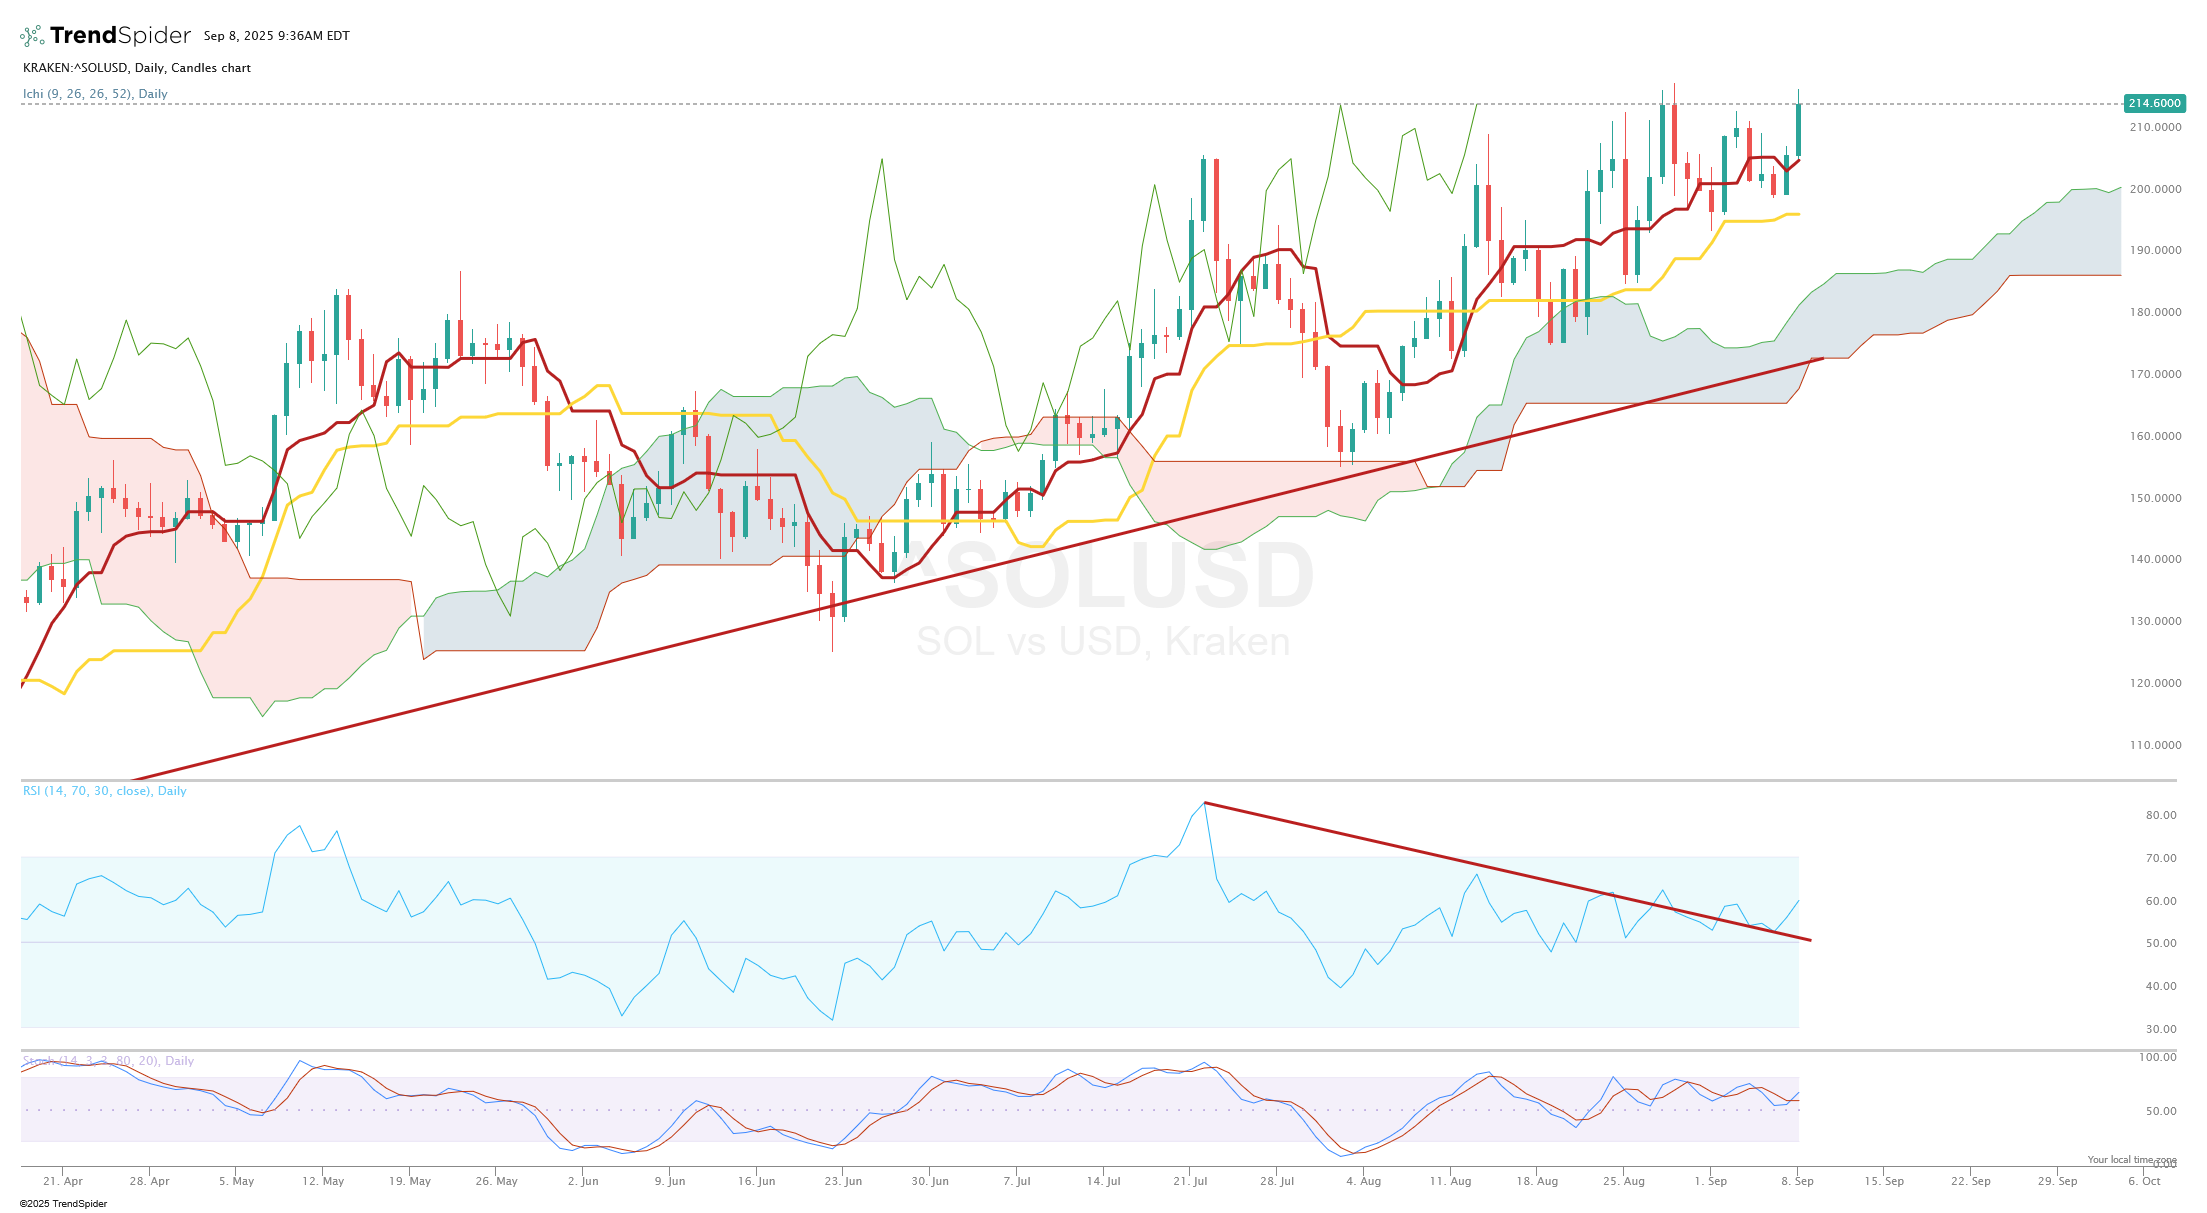
Bullish break of RSI resistance trend line. New upward move starts in SOLANA. I remain bullish as price continues to respect cloud support.
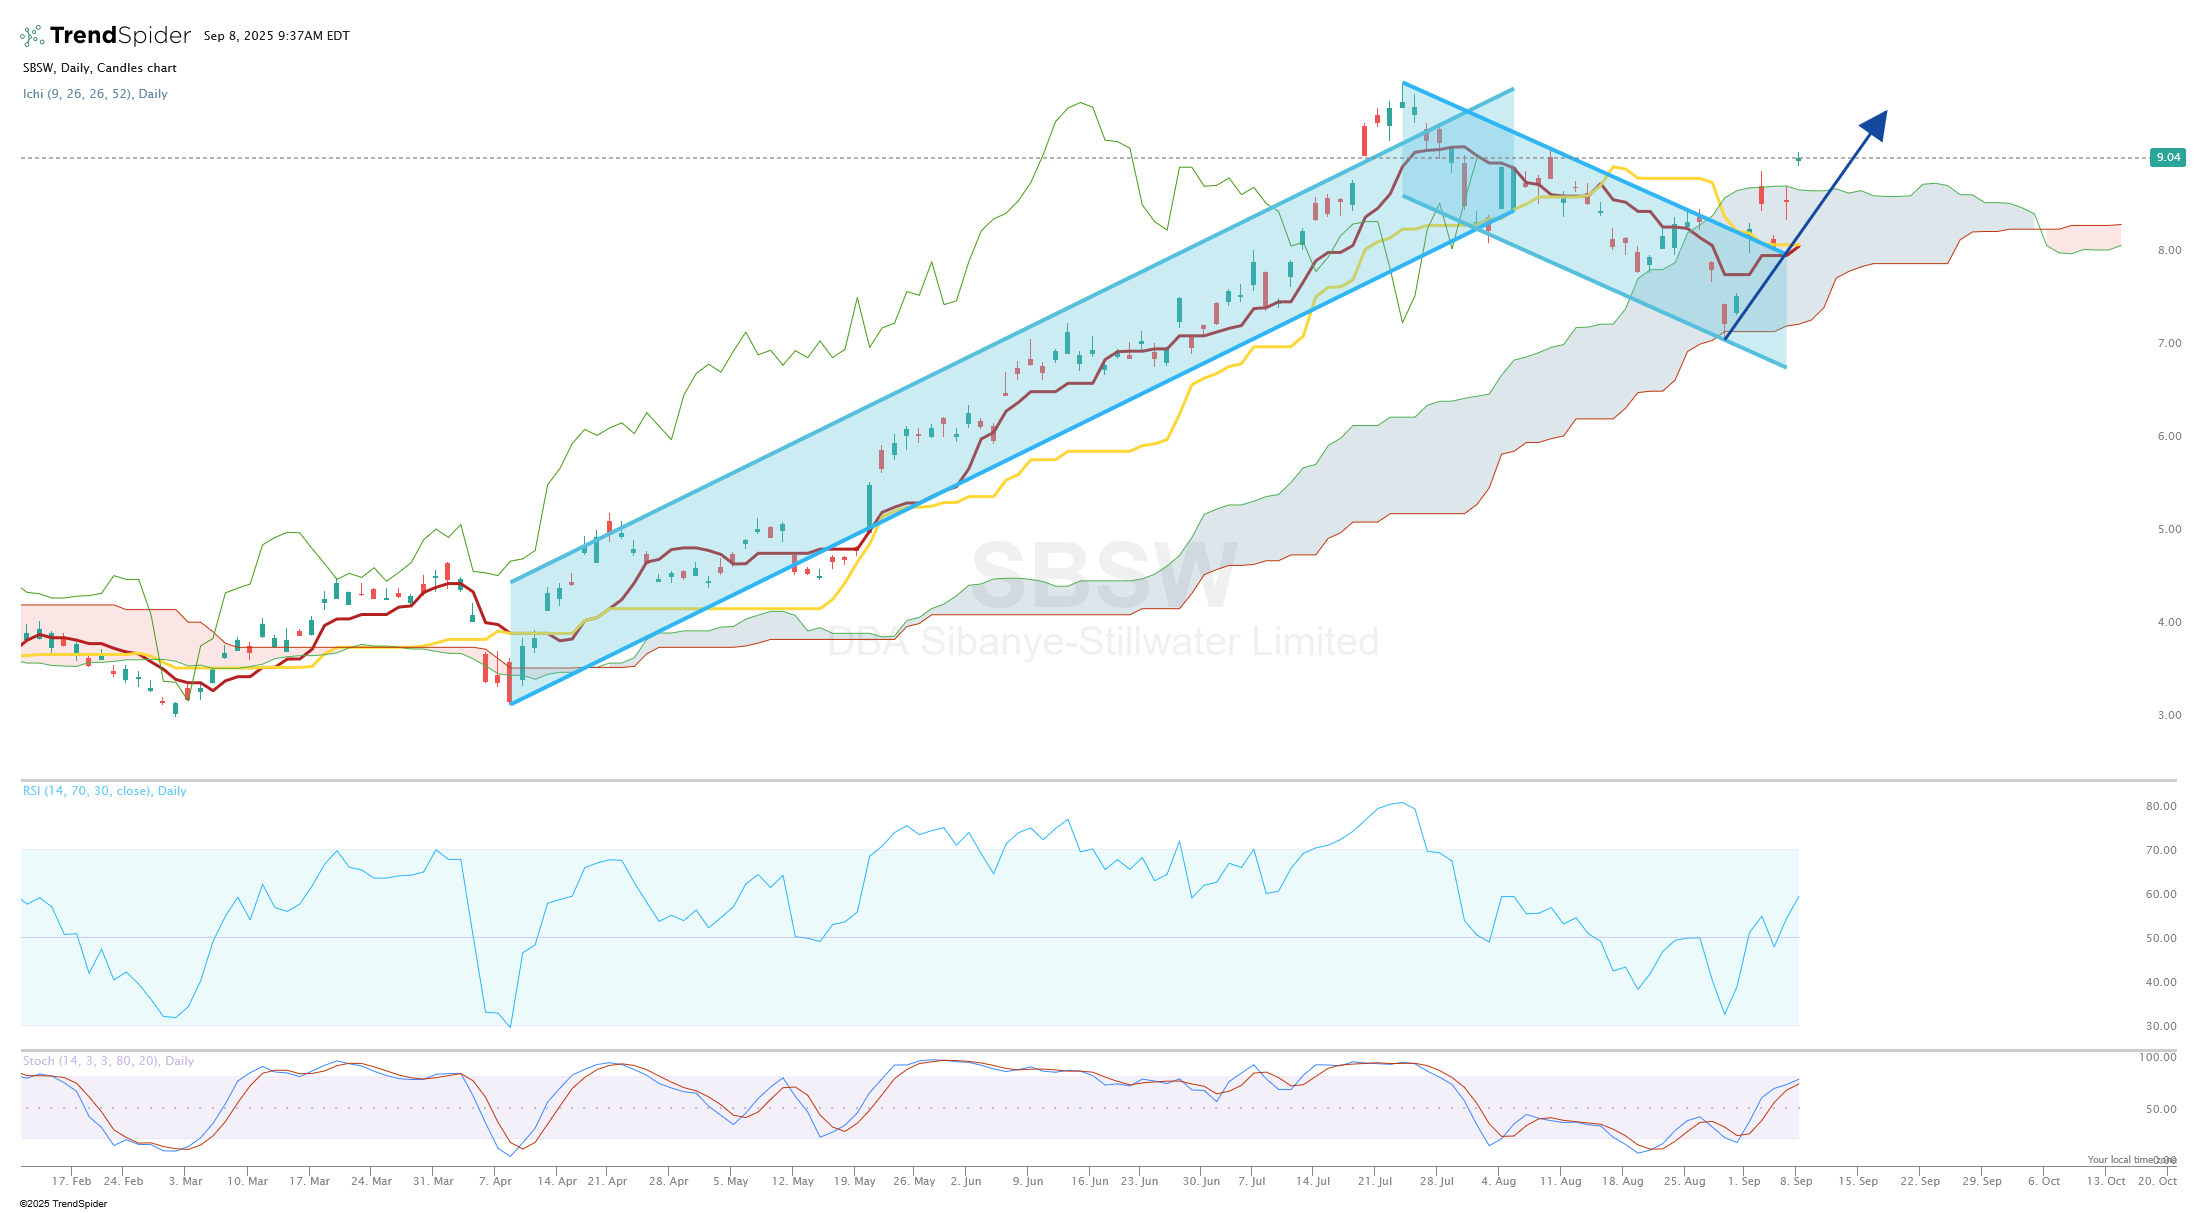
SBSW 0.00%↑ Bull flag breakout. Price also breaks above the cloud resistance after successfully testing it.
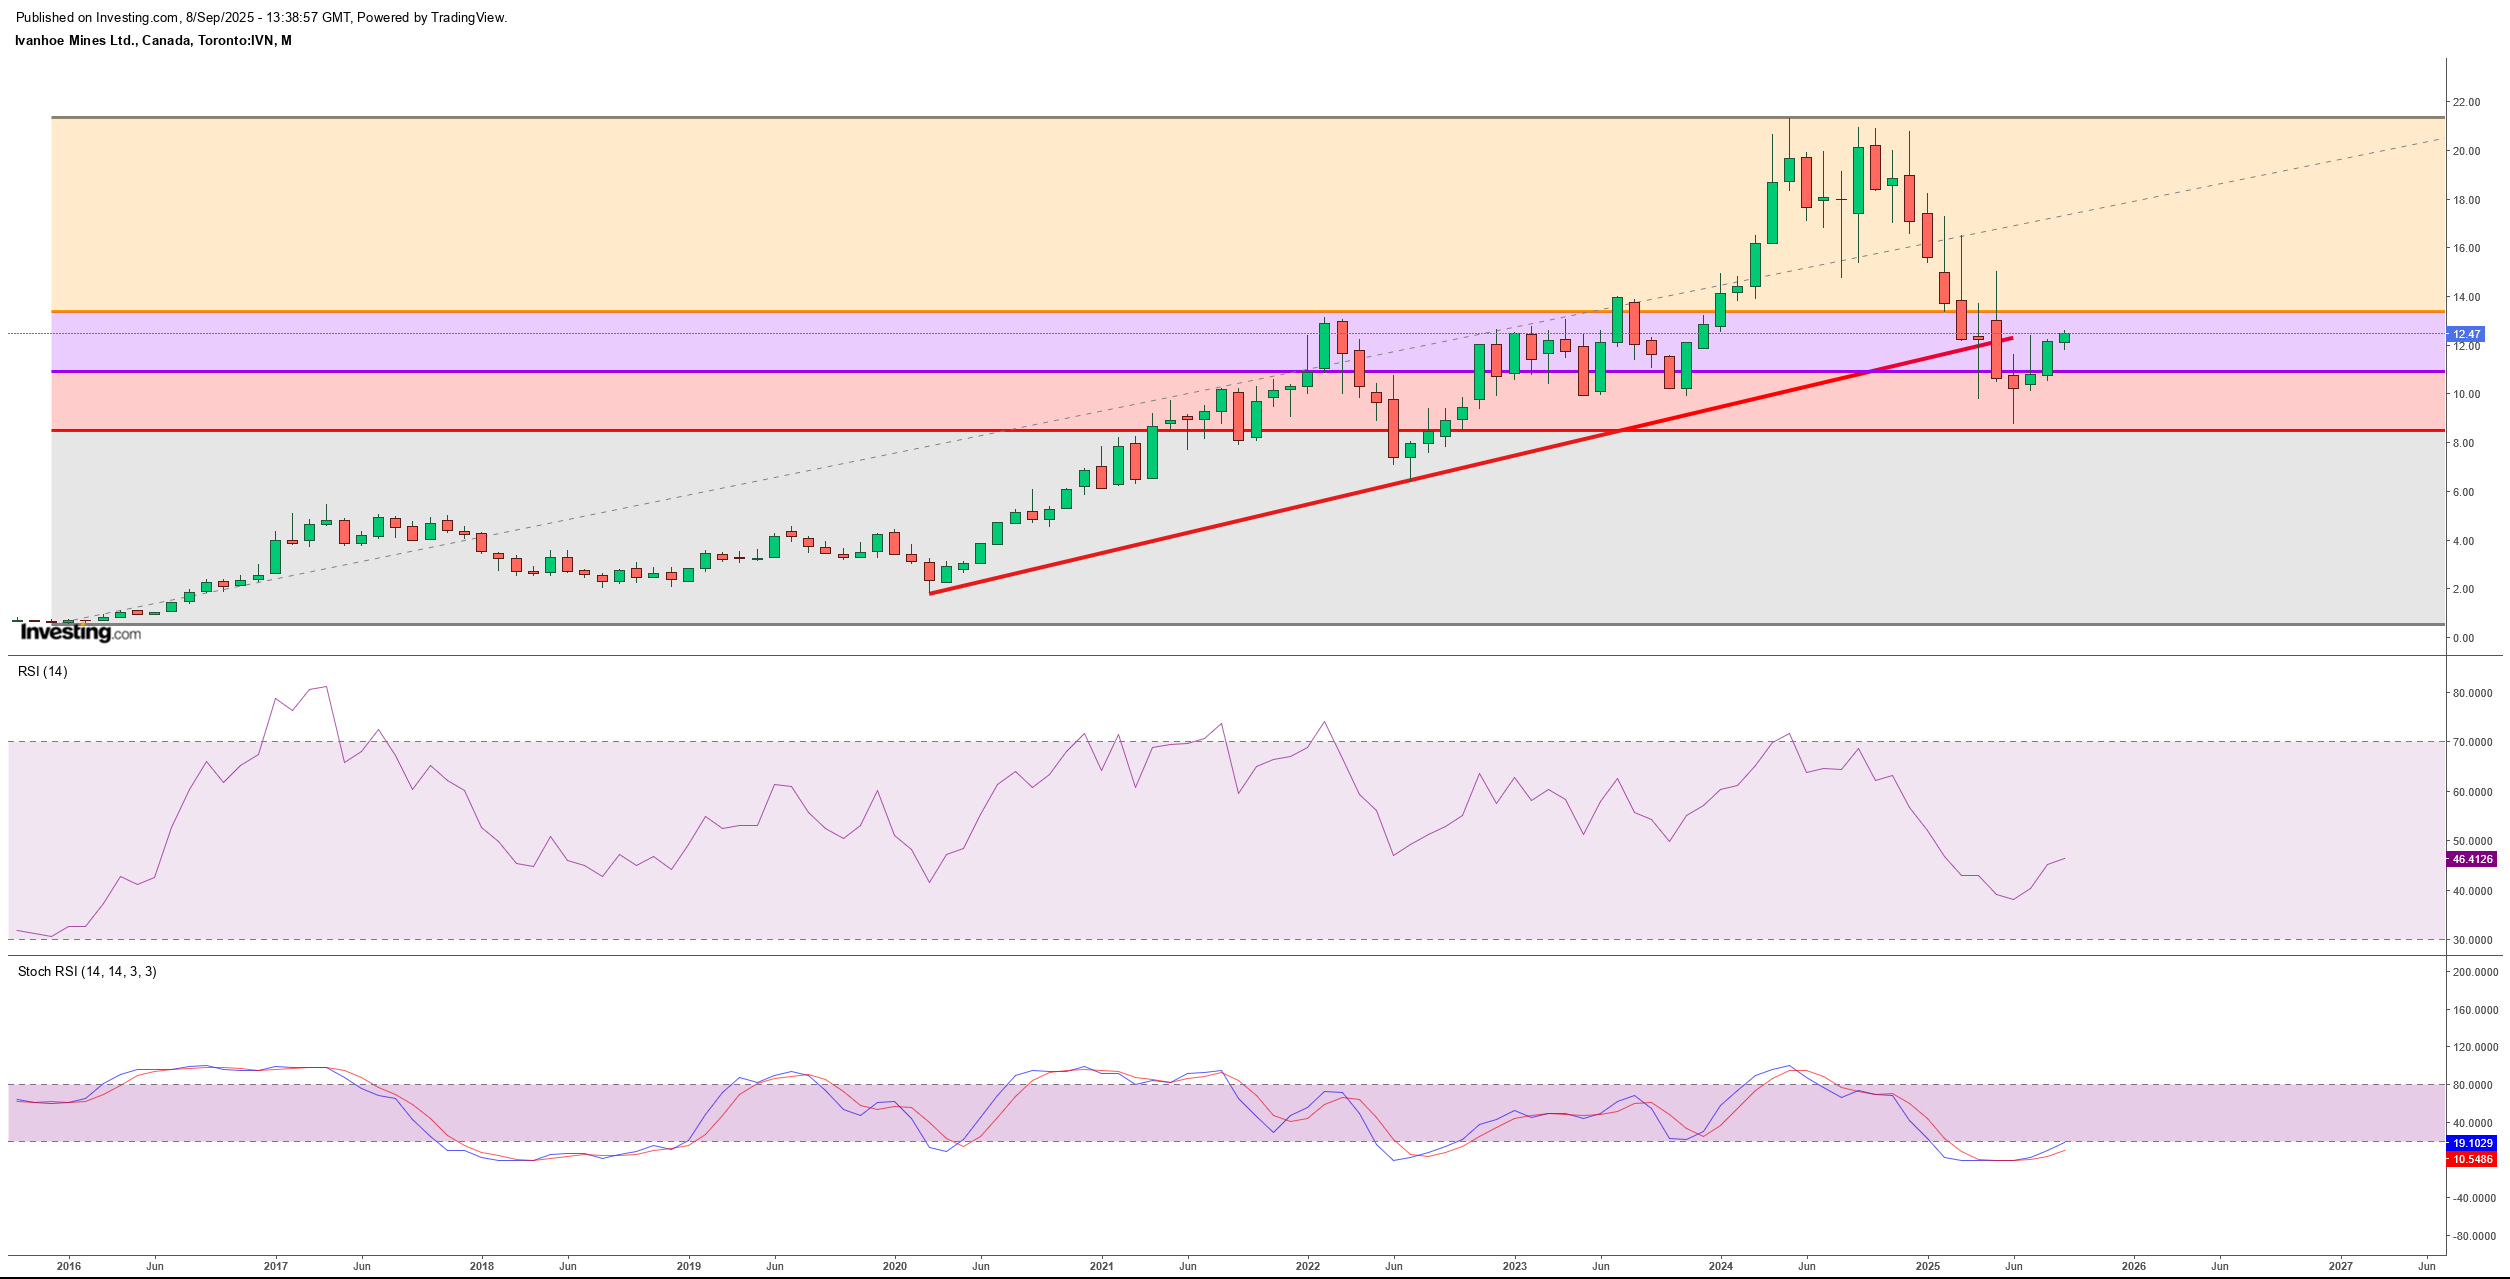
$IVN Long-term chart showing reversal off the 61.8% Fibonacci retracement.
All of the above I’m bullish with long positions (PLG, LTBR, AUMB, XRP, SOL, SBSW, IVN)
As always, this is not financial advice. Please do your own research and trade according to your own risk profile. I do not sell any services and I only use this platform as a journal for my trading and my thoughts. There is no holly grail in trading, do not look for the ONE system to give you money or the ONE GURU. Only hard work will do.